In this brief article, I’ll demonstrate how to identify missing values from your Connectorly views.
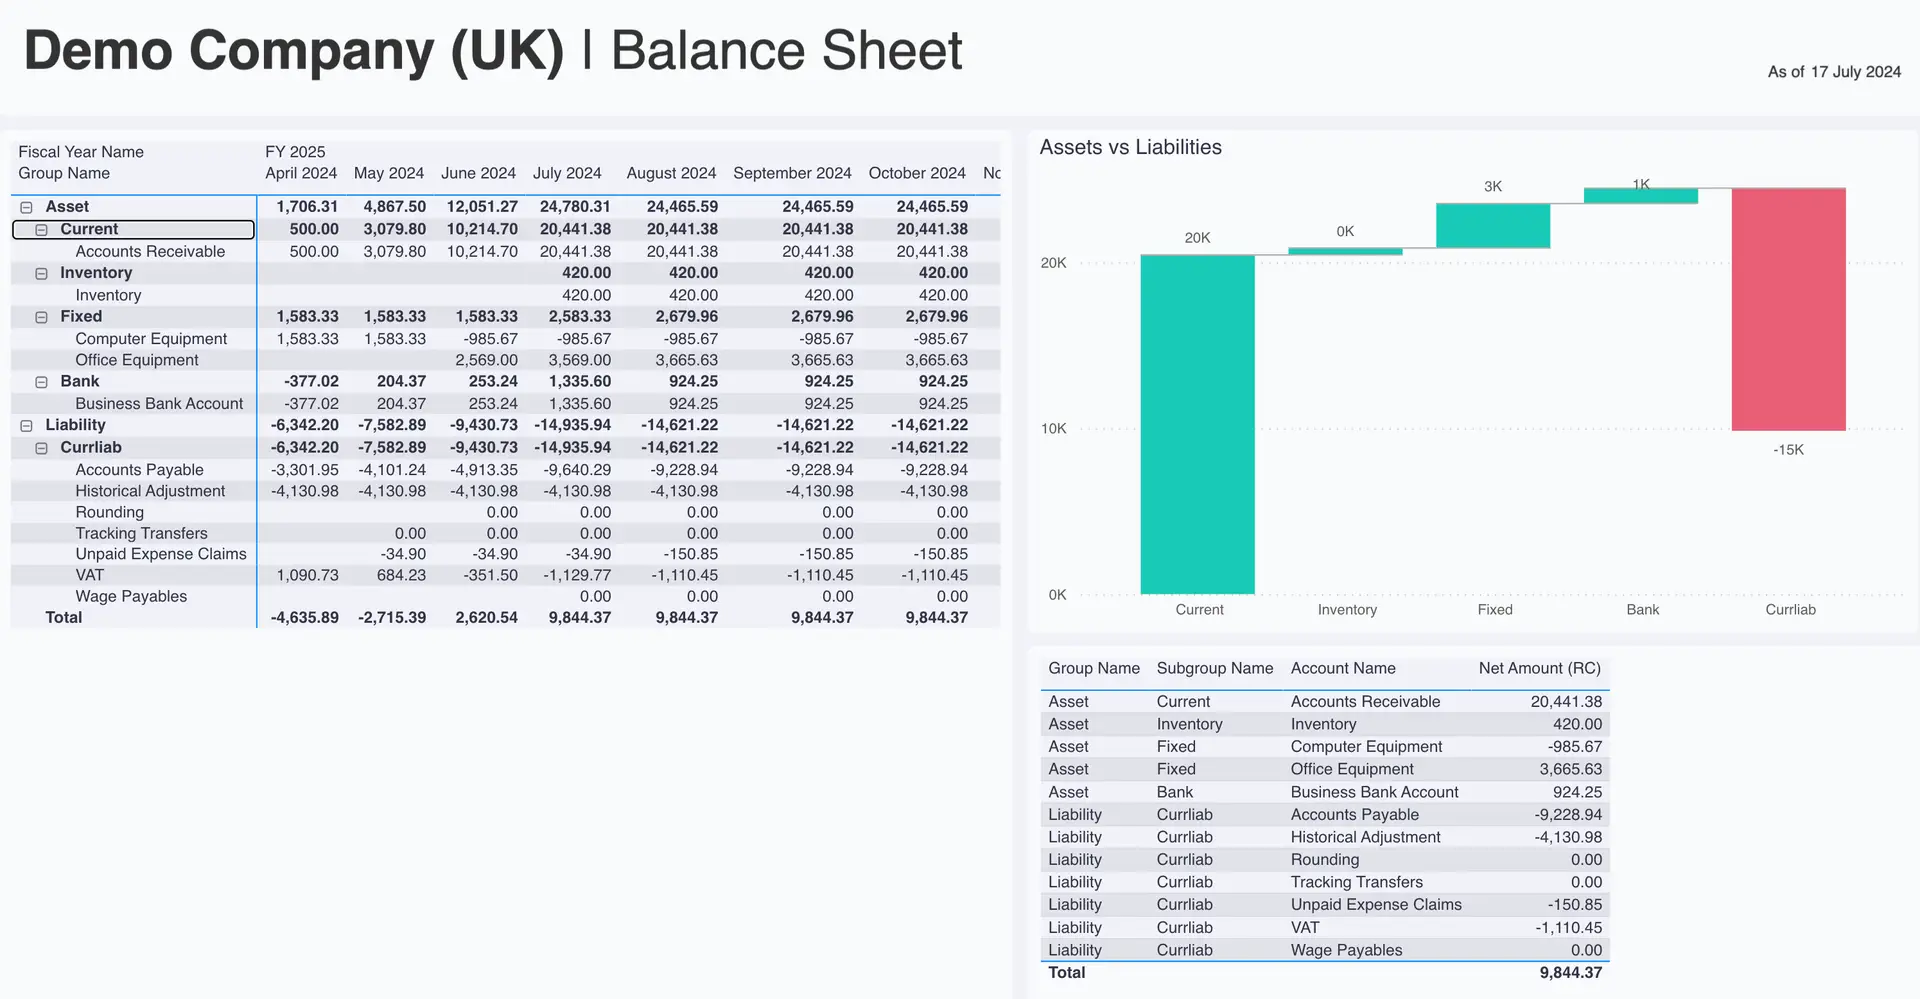
Previously, I have introduced the Connectorly Views that help you to create flexible reports on your Xero data to explore different cases and scenarios on your finances.
Connectorly Views works with the Chart of Accounts, the Contacts and the Products at the moment. In this article, we use the Chart of Accounts as an example. Let’s say you have created already a couple of views and now you wish to easily find out what are those Chart of Accounts that are not part of any of your views.
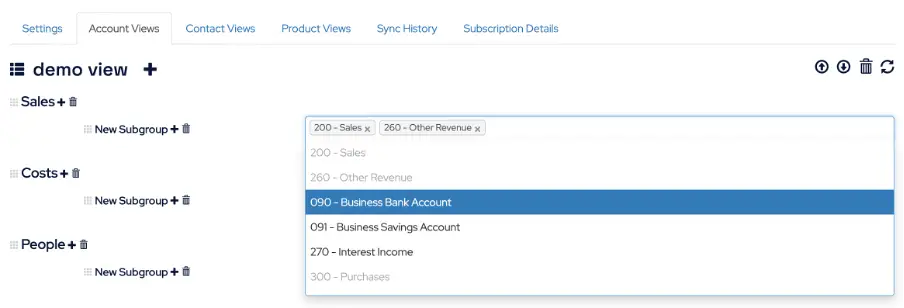
On the Connectorly Portal, you see the already assigned elements in grey colour and the available elements in black. This view is a bit hard to manage when you have a huge amount of Chart of Accounts in your Xero company or companies.
Use the Connectorly Xero templates
As you are already set up and connected to your Xero data, let’s use Microsoft Power BI desktop to show which account codes are not used at all in our views.
First, download one of the Connectorly Xero templates and open it. Connect to your database and let’s start it.
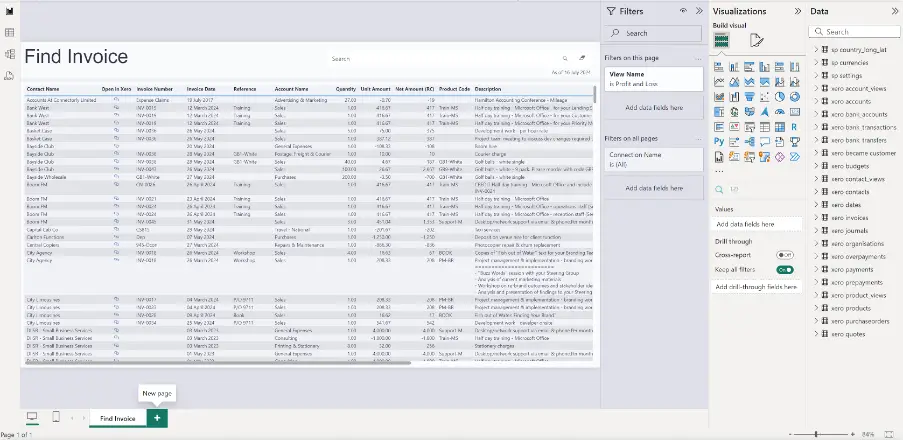
Add a new empty page where we can check the result of our activity.
Now, we are going to create 2 new tables that will help us to identify the non-used Chart of Accounts. In the Connectorly Xero Data Model, we hold all the Xero Chart of Accounts data in the “xero accounts” table.
Let's identify missing values from your Connectorly views
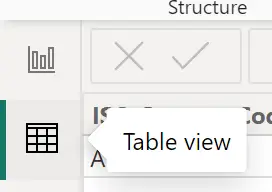
Now let’s switch to the Table view
Under the Table tools click on New Table.
Now we will use a DAX expression to create two new tables. The first will hold all account codes (without duplication). The second one will only hold those Chart of Accounts that are not in the “xero account_views” table, means they are not assigned to any views.

Use the following DAX expression to create your first table:
ALLCODE = INTERSECT(CALCULATETABLE(DISTINCT('xero accounts'[Account Code])), CALCULATETABLE(DISTINCT('xero account_views'[Account Code]))) 
Click on the New table button to create the second table with the following DAX expression:
ALLMISSINGCODE = EXCEPT(CALCULATETABLE(DISTINCT('xero accounts'[Account Code])), ALLCODE)Now, go back to the Report view and add two Table visualizations to see all the charts of accounts and the missing account codes.
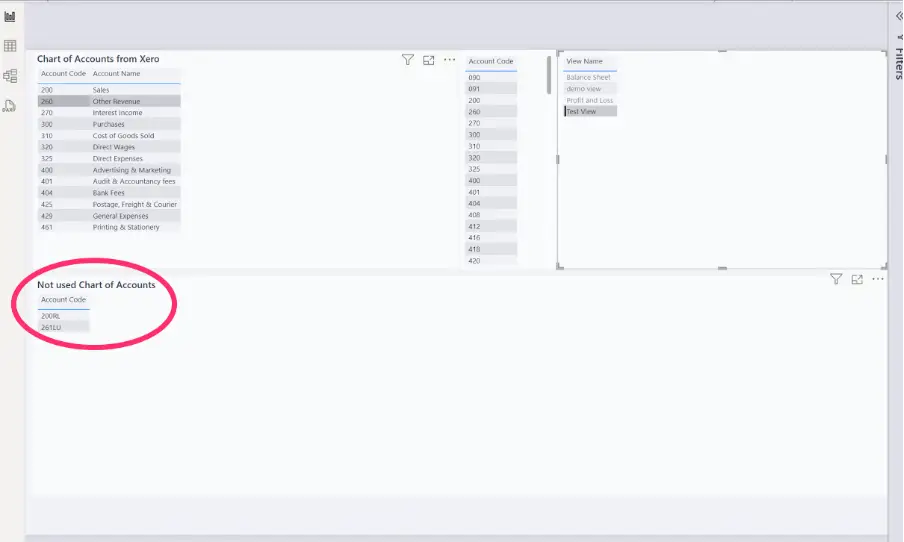
Test our solution
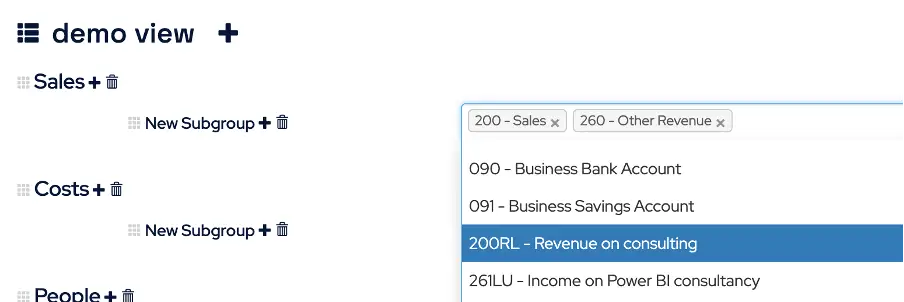
Let’s go back to the Connectorly portal and make some changes to include one of these missing account codes in a view.
In this example, I am going to assign 200RL account code to one of my views.
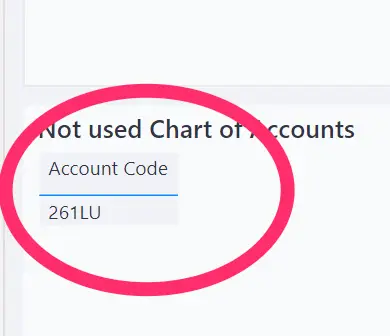
Go back to the Power BI desktop and refresh your report. You can see that the 200RL is not in the “Not used Chart of Accounts” list anymore.
Summary
This is a quick way to check if you included everything in your views. You can also use this trick if you need to find records that are present in one table but not in the other one. Of course, there are other ways to reach the same goal, this is just one solution.
Let us know if you have an easier way you use.

